Chapter 2 · Economics 112 / Core 153
Choices, Production, and Trade
Resources are limited. Economics begins with a precise question: what do we give up when we choose one use instead of another?
- Core models
- PPF · trade · circular flow
- Instructor
- Royce Vaughn
02.0
Orientation
The chapter in one idea
Every choice redirects scarce resources. The production possibilities frontier makes that constraint visible; opportunity cost measures the trade-off; comparative advantage shows how specialization and exchange can expand consumption.
- Distinguish resources, goods, and factor payments.
- Read, construct, and shift a production possibilities frontier.
- Calculate opportunity cost with ratios and slopes.
- Explain increasing opportunity cost.
- Identify absolute and comparative advantage.
- Demonstrate gains from trade and trace the circular flow.
02.1
The factors of production
Resources become output
Production converts inputs into goods and services. Economists group those inputs into four broad factors of production.
The categories describe a resource’s role in production—not simply what the resource looks like. A truck used for deliveries is physical capital; the gasoline it burns is a natural resource; the driver’s time and skill are labor.
| Factor | What it includes | Payment to its owner |
|---|---|---|
| Land | Natural resources: land, water, forests, minerals, energy | Rent |
| Labor | Human time, effort, and human capital—the skills embodied in workers | Wages and salaries |
| Physical capital | Produced resources used to make other output: tools, buildings, equipment | Interest or rental return |
| Entrepreneurship | Organizing production, innovating, and bearing the risk of profit or loss | Profit—or loss |
Do not confuse physical capital with financial capital. Money can purchase a machine, but the machine—not the money—is the productive resource in this model.
A neighborhood bakery
The storefront lot and water are land; the bakers’ time and training are labor; ovens and mixers are physical capital; and the owner’s decision to open, choose a menu, coordinate the inputs, and accept possible losses is entrepreneurship.
Classify the resource
Classify each item and name its usual payment:
- Water used by a beverage company
- A technician’s time and certifications
- A delivery van used by a florist
- The florist who chooses the product line and bears the risk of loss
Answer 1 is at the end of the chapter.
02.2
The production possibilities frontier
The edge of what is possible
A production possibilities frontier (PPF) shows the maximum attainable combinations of two outputs given current resources and technology.
It is a boundary, not a forecast. The PPF does not predict what society will produce; it separates attainable combinations from combinations that current productive capacity cannot reach.
Model assumptions
- Two output categories so the trade-off fits on a graph.
- Fixed resources while we analyze movement along one frontier.
- Fixed technology for the same reason.
- Full and efficient use is required to produce on the frontier.
| Combination | Pizzas | Public lectures |
|---|---|---|
| A | 0 | 20 |
| B | 25 | 15 |
| C | 50 | 10 |
| D | 75 | 5 |
| E | 100 | 0 |
More of one output requires less of the other.
Idle or misallocated resources leave output unrealized.
More or better resources or technology would be required.
Read three production points
Use the numbered graph above at its starting maximums: 100 pizzas and 20 lectures. Its five labeled frontier points are A (0, 20), B (25, 15), C (50, 10), D (75, 5), and E (100, 0).
- Point C: (50 pizzas, 10 lectures) is on the PPF: attainable and productively efficient.
- (50 pizzas, 6 lectures) is inside: attainable but inefficient.
- (80 pizzas, 10 lectures) is outside: current capacity cannot produce it.
Locate each point
Use the pre-drawn graph above—not the table alone—to classify each combination as on, inside, or outside. Then state what the classification means.
- (25 pizzas, 15 lectures)
- (60 pizzas, 12 lectures)
- (40 pizzas, 8 lectures)
Answer 2 is at the end of the chapter.
02.3
Opportunity cost and slope
Measure what the choice gives up
The ratio and slope methods are equivalent. For the opportunity cost of the horizontal-axis good, both divide the change in the vertical-axis good by the change in the horizontal-axis good. On a downward-sloping PPF, the slope is negative; opportunity cost reports its absolute value. For the vertical-axis good, reverse the fraction: OCy = |Δx / Δy| = 1 / OCx.
Units prevent inverted answers
“0.2” is incomplete. “0.2 lectures per pizza” says exactly which output was forgone and which was gained. If the units do not answer the question, the ratio is backward.
Slope and opportunity cost
The slope of a downward-sloping PPF is negative. Opportunity cost is reported as a positive sacrifice, so use the absolute value. The slope gives the cost of the horizontal-axis good; its reciprocal gives the cost of the vertical-axis good.
Worked graph
Calculate opportunity cost from a linear PPF
The chapter frontier has fixed intercepts of 100 pizzas and 20 public lectures. Because it is a straight line, its slope and both opportunity costs are constant everywhere on the frontier.
One pizza costs 0.2 lecture; one lecture costs 5 pizzas. The two opportunity costs are reciprocals.
OCx · one pizza
Ratio method · A → E
20 lectures forgone100 pizzas gained = 0.2 lecture per pizza
Slope method · A → E
= 0.2 lecture per pizza
OCy · one lecture
Ratio method · E → A
100 pizzas forgone20 lectures gained = 5 pizzas per lecture
Slope method · E → A
= 5 pizzas per lecture
Use both methods
On the linear pizza-and-lecture PPF:
| Point | Pizzas | Lectures |
|---|---|---|
| B | 25 | 15 |
| D | 75 | 5 |
- Move from B (25, 15) to D (75, 5). Find the opportunity cost of one additional pizza using forgone/gained.
- Move from D back to B. Find the opportunity cost of one additional lecture.
- Confirm both answers using slope and the reciprocal check.
Answer 3 is at the end of the chapter.
Worked graph
Make resources more specialized
When workers and machines differ in their best uses, moving each new group of resources becomes more costly. The frontier bows outward.
Each step adds the same 10 natural-gas units.
Read the bow correctly
Near the vertical intercept the PPF is relatively flat: early units of the horizontal good are inexpensive. Near the horizontal intercept it becomes steep: additional horizontal output requires a larger vertical sacrifice.
On a curved PPF there is no single constant opportunity cost. Name the two points or the specific interval you are measuring.
A genuinely bowed frontier
The economy increases natural-gas production from 10 to 20 units, while crude-oil production decreases from 28 to 24 units.
Ten natural-gas units are gained and four crude-oil units are forgone, so the opportunity cost is 0.4 crude-oil unit per natural-gas unit.
Increasing cost
The economy increases natural-gas production from 20 to 30 units, while crude-oil production decreases from 24 to 15 units.
- Find the opportunity cost of one additional natural-gas unit.
- Compare it with the worked example. What economic fact explains the change?
Answer 4 is at the end of the chapter.
02.4
When the frontier changes
Movements, recovery, and growth
Movement along a frontier
A different output mix. The economy produces more of one good and less of the other. Productive capacity has not changed.
Movement toward the frontier
Idle resources return to use or organization improves. Output rises, but the maximum possible combinations have not changed.
A shift of the frontier
Productive capacity changes because resources or technology change. Growth shifts at least part of the frontier outward; lost resources can shift it inward.
A change that benefits only one industry can pivot the frontier rather than shifting both intercepts equally.
Worked graph
Growth expands the frontier
On the original PPF, point A is attainable but inefficient and point B is attainable and efficient. Point C is outside the original PPF, but growth shifts the frontier outward until C becomes attainable and efficient.
A · Inside: unused productive capacity
B · On the original PPF: efficient production
C · On the growth PPF: greater productive capacity
An improved excavator
Hiring an unemployed excavator operator moves production from inside the current PPF toward it. Inventing an excavator that moves twice as much earth with the same labor and fuel changes technology and shifts the relevant part of the PPF outward.
Movement or shift?
Classify each change as movement along, movement toward, outward shift, inward shift, or pivot. Explain briefly.
- Unemployed workers return to their former jobs.
- A larger, healthier, better-educated labor force increases capacity across industries.
- A new oven raises only pizza output.
- A hurricane destroys factories and infrastructure.
- On the same PPF, the economy chooses more capital goods and fewer consumer goods.
Answer 5 is at the end of the chapter.
02.5
Comparative advantage and gains from trade
The Gains From Trade Model
Specialize by opportunity cost
The ability to produce more of a good with the same resources.
The ability to produce a good while giving up less of another good.
Absolute advantage tells us who can produce more. Comparative advantage determines specialization. A producer can be best at everything and still gain by allowing another producer to handle the task with the lower relative cost.
| Country | Crude oil | Natural gas |
|---|---|---|
| United States | 30 | 40 |
| Venezuela | 10 | 30 |
Venezuela
United States
United States and Venezuela
The United States has absolute advantage in both goods. Comparative advantage requires opportunity costs:
| Cost of one… | United States | Venezuela | Lower cost |
|---|---|---|---|
| Natural-gas unit | OCng = 30/40 = 0.75 crude-oil unit | OCng = 10/30 = 0.33 crude-oil unit | Venezuela |
| Crude-oil unit | OCco = 40/30 = 1.33 natural-gas units | OCco = 30/10 = 3 natural-gas units | United States |
Venezuela specializes in natural gas; the United States specializes in crude oil. The pattern follows relative cost, not which country is “better” overall.
One equal-gains allocation: the United States consumes (20 gas, 20 oil) and Venezuela consumes (10 gas, 10 oil). Each country receives 4 more natural-gas units and 2 more crude-oil units than in the closed economy.
Interactive model
Find a price both sides can accept
The United States exports crude oil; Venezuela exports natural gas. The price is measured in natural-gas units paid for one crude-oil unit.
Both sides can gain at this price.
United States
+0.67natural-gas units gained in value per crude-oil unit exportedVenezuela
+1.00natural-gas units saved in value per crude-oil unit importedTerms of trade
A mutually beneficial price lies between the two opportunity costs. At an endpoint, one side is indifferent; strictly between them, both can receive more value than the same trade would cost domestically.
1.33 < price < 3 natural-gas units per crude-oil unit
Wendy and Jack
Wendy can make 100 ice creams or 50 loaves of bread. Jack can make 50 ice creams or 30 loaves. Assume linear PPFs.
Wendy
Jack
- Compute all four opportunity costs with units.
- Identify absolute advantage in each good.
- Identify comparative advantage and the efficient pattern of specialization.
- State the open interval of mutually beneficial terms of trade in ice creams per loaf.
Answer 6 is at the end of the chapter.
Test the price
Using Wendy and Jack, decide whether both would accept each price. Explain with opportunity costs.
- 1.5 ice creams per loaf
- 1.8 ice creams per loaf
- 2.5 ice creams per loaf
Answer 7 is at the end of the chapter.
02.6
Follow resources, output, and money
The Circular-Flow Model
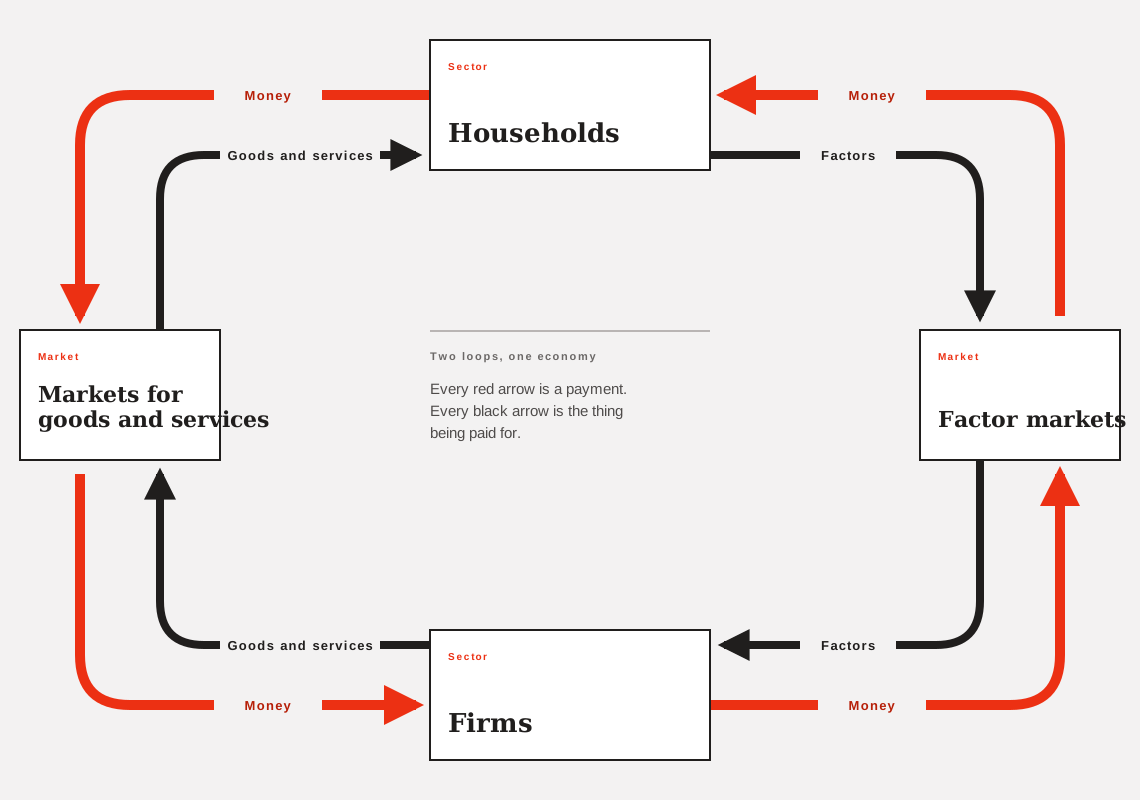
The circular-flow model connects production to exchange. In its simplest form, it contains two decision makers and two markets.
Households own productive resources and purchase goods and services. Firms hire resources and sell the resulting output.
Two markets
- Markets for goods and services: firms sell; households buy.
- Markets for factors of production: households sell resource services; firms buy.
Model diagram
Trace the two loops
The inner black loop carries real flows: goods and services move through the goods market, while factors of production move through factor markets.
The outer red loop carries money flows in the opposite direction.
Why this model matters
Three questions every economy answers
The circular-flow model links the economy’s purpose—turning scarce resources into output—to the institutions that determine production and distribution.
What is produced?
Household demand and firms’ production decisions meet in markets for goods and services.
How is it produced?
Firms combine labor, land, physical capital, and entrepreneurship obtained through factor markets.
Who gets it?
Income earned from supplying resources gives households purchasing power; goods and services flow to the buyers who use that income.
One student, two markets
When a student works at a café, the household is a seller in the factor market and the café is a buyer; labor flows to the firm and wages flow to the household. When the same student buys coffee, the household is a buyer in the goods market and the café is a seller; coffee flows to the household and spending flows to the firm.
Trace both sides of the exchange
- A graphic designer works for a software firm. Identify the market, buyer, seller, real flow, and money flow.
- The designer uses part of the wage to buy a laptop. Identify the market, buyer, seller, real flow, and money flow.
- Name three important sectors omitted from the basic two-sector model.
Answer 8 is at the end of the chapter.
02.7
Put the models together
Additional practice
Work and leisure
You have eight hours. Each hour of work earns $20; every hour not worked is leisure.
- Construct the endpoint combinations and graph earnings vertically.
- Find the slope.
- Find the opportunity cost of one leisure hour.
- Find the opportunity cost of one dollar of earnings.
- Why is the PPF linear? Give one change that would make it bowed.
Answer 9 is at the end of the chapter.
Kelly and Jack on an island
Per hour, Kelly can gather 10 coconuts or 12 fish. Jack can gather 10 coconuts or 15 fish.
- Graph both PPFs with fish vertically.
- Compute every opportunity cost.
- Identify absolute and comparative advantage.
- State the efficient specialization pattern.
Answer 10 is at the end of the chapter.
Spot every error
“Venezuela produces less crude oil and natural gas, so it has nothing useful to offer the United States. The United States should make both goods. Any trade must make Venezuela poorer.”
Identify and correct every distinct economic error.
Answer 11 is at the end of the chapter.
A changing economy
For each event, name the PPF change and one circular-flow effect.
- A recession leaves workers and machines idle.
- A technical college raises worker skills across local industries.
- A flood destroys roads, stores, and equipment.
Answer 12 is at the end of the chapter.
02.8
Check reasoning, units, and vocabulary
Answer key
An answer is complete only when the reasoning and units are clear. Equivalent wording is acceptable when the economics is precise.
1 · Classify the resource
- Land; rent.
- Labor, including human capital; wages or salary.
- Physical capital; interest or rental return.
- Entrepreneurship; profit or loss.
2 · Locate each point
- (25, 15) is on the PPF: attainable and productively efficient.
- At 60 pizzas the frontier allows 8 lectures, so (60, 12) is outside and currently unattainable.
- At 40 pizzas the frontier allows 12 lectures, so (40, 8) is inside: attainable but productively inefficient.
3 · Use both methods
B→D gains 50 pizzas and forgoes 10 lectures: 10/50 = 0.2 lectures per pizza. D→B gains 10 lectures and forgoes 50 pizzas: 50/10 = 5 pizzas per lecture. Slope = (5−15)/(75−25) = −0.2 lecture per pizza; its absolute value and reciprocal confirm the answers. 0.2 × 5 = 1.
4 · Increasing cost
Moving from (20, 24) to (30, 15) gains 10 natural-gas units and forgoes 9 crude-oil units: 0.9 crude-oil unit per natural-gas unit. That exceeds the earlier 0.4 because resources moved later are less suited to natural-gas production.
5 · Movement or shift?
- Movement toward the existing PPF.
- Outward shift.
- Pivot outward on the pizza axis.
- Inward shift.
- Movement along the existing PPF.
a · Recovery
b · Outward shift
c · Pizza-axis pivot
d · Inward shift
e · Along the PPF
6 · Wendy and Jack
| Wendy | Jack | |
|---|---|---|
| OC of one loaf | 100/50 = 2 ice creams | 50/30 = 1.67 ice creams |
| OC of one ice cream | 50/100 = 0.5 loaf | 30/50 = 0.6 loaf |
Wendy has absolute advantage in both goods. Jack has comparative advantage in bread; Wendy has comparative advantage in ice cream. Specialize accordingly. Mutually beneficial terms are 1.67 < price < 2 ice creams per loaf.
Wendy
Jack
7 · Test the price
- At 1.5, Jack refuses: a loaf costs him 1.67 ice creams to make.
- At 1.8, both accept: Jack receives more than 1.67 and Wendy pays less than 2.
- At 2.5, Wendy refuses: she can make a loaf herself for 2 ice creams.
Wendy
Jack
8 · Trace the exchange
- Factor market: the household/designer sells labor; the firm buys. Design labor flows to the firm; wages flow to the household.
- Goods market: the computer firm sells and the household buys. The laptop flows to the household; spending/revenue flows to the firm.
- Common omissions: government, the financial system, and the rest of the world.
9 · Work and leisure
Endpoints are (0 leisure, $160 earnings) and (8 leisure, $0 earnings). Slope = (0−160)/(8−0) = −$20 per leisure hour. One leisure hour costs $20 of earnings; one dollar of earnings costs 0.05 leisure hour. The PPF is linear because every work hour earns the same wage. Fatigue, changing productivity, or an overtime premium could make the trade-off nonlinear.
10 · Kelly and Jack
| Kelly | Jack | |
|---|---|---|
| OC coconut | 12/10 = 1.2 fish | 15/10 = 1.5 fish |
| OC fish | 10/12 = 0.83 coconut | 10/15 = 0.67 coconut |
Neither has absolute advantage in coconuts; Jack has absolute advantage in fish. Kelly has comparative advantage in coconuts; Jack has comparative advantage in fish. Kelly should specialize relatively toward coconuts and Jack toward fish.
Kelly
Jack
11 · Spot every error
- Absolute disadvantage does not imply no gains from trade; comparative advantage determines specialization.
- Venezuela’s opportunity cost of natural gas is lower, so it has comparative advantage in natural gas.
- If the United States produces natural gas, it gives up crude oil at a higher rate than Venezuela does.
- Under the model, voluntary trade at mutually beneficial terms can make both countries better off; Venezuela is not forced to accept a harmful price.
Venezuela
United States
12 · A changing economy
- The economy moves inside the unchanged PPF. Lower production reduces firms’ revenue, factor purchases, and household income.
- Better human capital shifts the PPF outward. More productive labor can raise output, wages, sales, and income flows.
- Destroyed physical capital and infrastructure shift the PPF inward. Production, factor demand, household income, and goods-market exchange may fall.